- Published on
Gaining Visibility into GraphQL with Inigo Analytics
- Authors

- Name
- Andrew Blase
Introduction
In the vast ocean of web development, GraphQL emerges as a beacon of innovation. Its dynamic approach to data retrieval has revolutionized how developers interact with databases. But, as the saying goes, "With great power comes great responsibility." Enter Inigo, your compass in the intricate world of GraphQL analytics.

The Need for Analytics in GraphQL
Navigating the GraphQL seas without a compass can be daunting. The technology, while powerful, presents its unique set of challenges. The most pressing? Visibility. As Shahar Binyamin and Eitan Joffe from Inigo aptly put it in a recent chat,
GraphQL is a blind spot for most engineers and security teams. Proper contextualized analytics and error handling is critical for healthy GraphQL systems at scale.
This underscores the importance of a clear view beneath the surface.
Inigo's Unique Approach to GraphQL Analytics
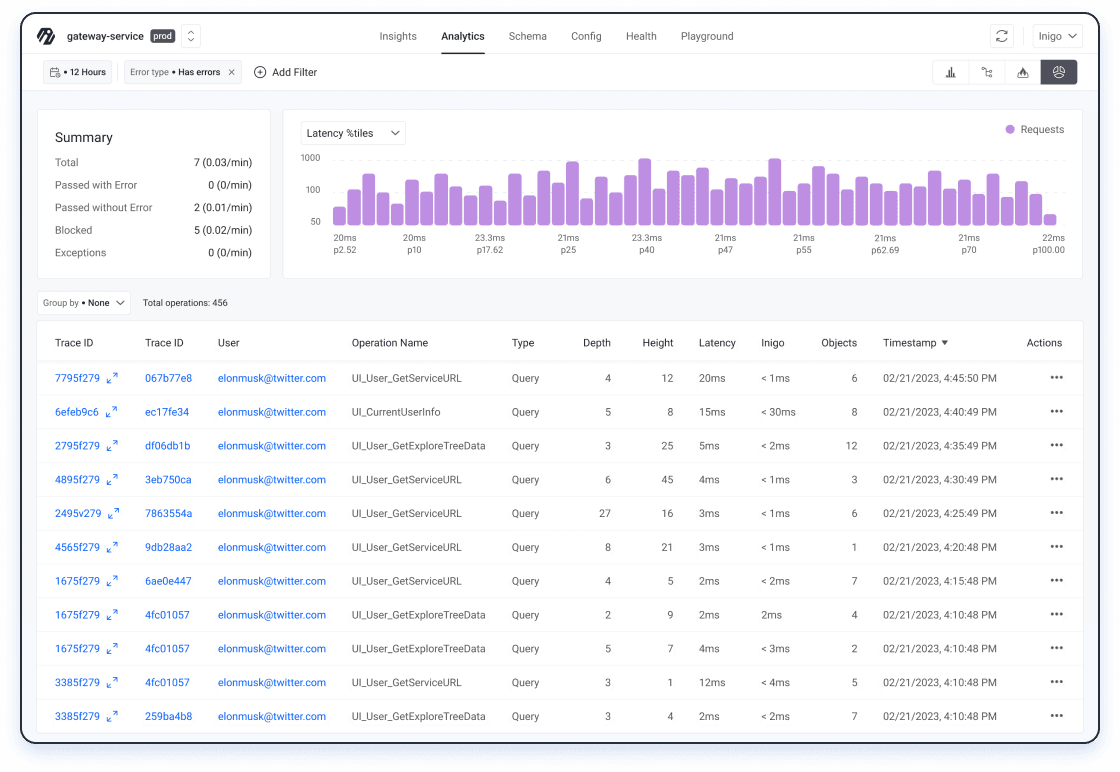
Inigo isn't just another tool; it's a revelation. It offers more than just data; it provides context. With its capability for query-level granularity and subgraph visibility, Inigo ensures developers have a panoramic view of their GraphQL operations. Whether it's understanding query performance or pinpointing errors, Inigo offers insights that are both profound and actionable.
Real-time Insights with Inigo
In the digital realm, time is of the essence. Real-time insights aren't a luxury; they're a necesity. Inigo gets this. It offers instantaneous insights into GraphQL operations, ensuring developers can pivot and optimize in real-time. Moreover, its robust error handling mechanism ensures that issues are not just logged but addressed promptly. Acording to Shahar and Eitan,
The analytics really helps for these situations because you can quickly see what's happening to your customers.
Inigo vs. Apollo Studio
The world of GraphQL analytics isn't a monopoly. Tools like Apollo Studio have made their mark. But Inigo stands out. Whether it's the depth of analytics, ease of integration, or granularity of insights, Inigo consistently shines bright, making it an excellent choice for many developers.
The Power of Visibility
Visibility isn't just about seeing; it's about understanding. In the realm of GraphQL, this rings especially true. Having a clear view into operations means preempting issues, optimizing performance, and enhancing user experience. With Inigo, developers aren't just observers; they're visionaries.
Interactive Dive into Inigo's Features
For those visual learners, let's take a guided tour of Inigo's features:
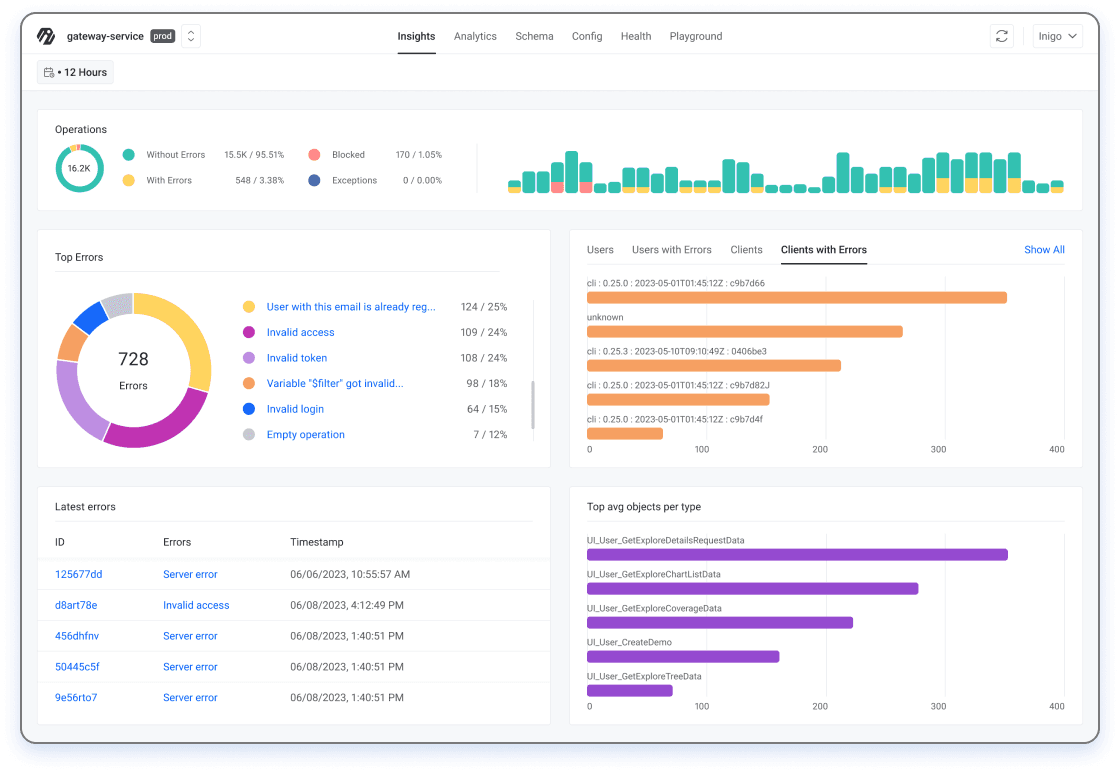
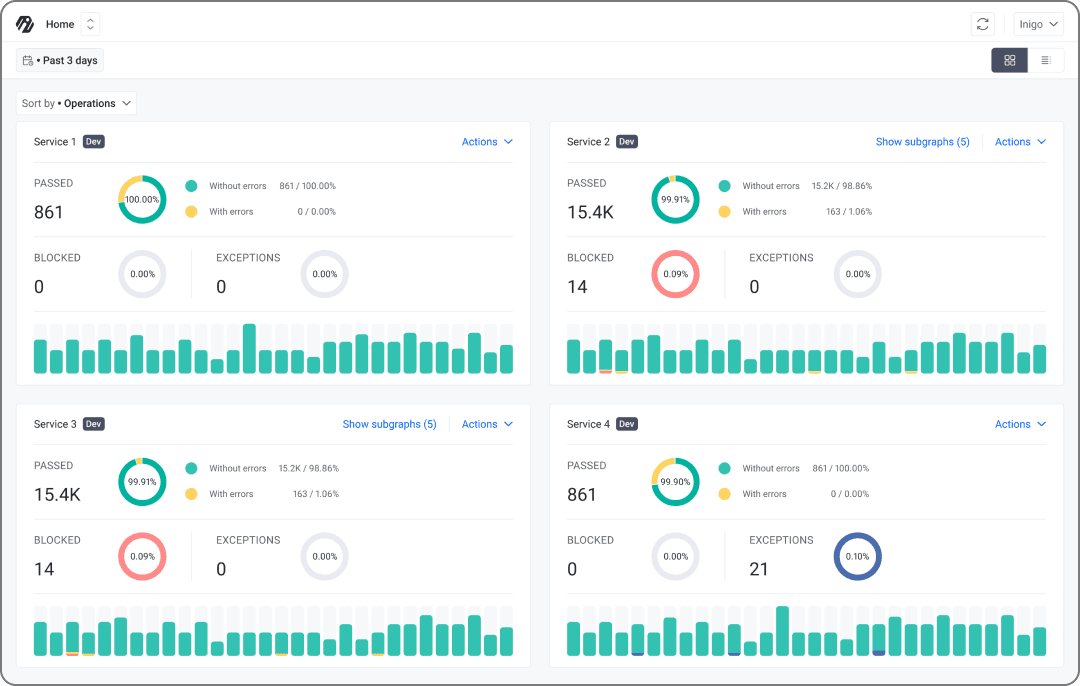
- Overview of UI Analytics: A bird's eye view of the entire GraphQL operation, from top errors to user activity.
- Error Handling: A deep dive into how Inigo categorizes and addresses errors, ensuring smooth operations.
- Coverage View: Think of it as a health check for your API, understanding which fields are active and which aren't.
Conclusion
GraphQL is here to stay, and as its adoption grows, so does the need for effective analytics. Inigo, with its comprehensive features and user-centric approach, offers a beacon of light in the often complex world of GraphQL analytics. For those looking to gain a competitive edge, diving deep into Inigo's capabilities might just be the key.